Weekend Project: DB DiaYAML
Why
When thinking about problems I sometimes come up with ideas on how to solve them. It might be a great solution, but more often than not they need some finesse and I may want to discuss them with other developers.
I find diagrams are a highly effective way of either organising my own thoughts or explaining them to other people. The diagrams themselves often don't need to be pretty or polished, they just need to be enough to support the idea, which might ultimately prove to be pretty rubbish. If I need to do the diagram again once the ideas have been proven, fine, but right now I need to draw something fast.
For this reason I am a fan of Asciiflow which I wrote about here and I have also found GraphViz / DOT to be an excellent tool. With GraphViz / DOT I have also gone much further, in SyncIt if you're running the tests in the brower you can uncomment one line and the tests will output diagrams of internal data structures to support debugging, this was a huge time saver when it came to debugging.
I have also used GraphViz / DOT to draw database diagrams however the format itself is not particularly well suited to the job requiring some duplication and the syntax for basic vertical tables is a little bit tricky. Even so when I'm only looking at low numbers of tables I'd probably still prefer to do GraphViz / DOT than fire up some graphical tool which I won't even have installed.
The Creation (UNIX Style)
Being frustrated and having my itch to scratch I spent a few journeys to / from work and half a day over the weekend creating DB DiaYAML which takes simple YAML (or JSON) files like this:
person: # A Table
    name: # A Field
address:
    line1:
    line2:
    person: # Link adds a foreign key (missing field implies `id`, will be added if not already existing!)
    link: person
order:
    address: address # Shorter version of a foreign key
a:
    letter:
        link: person.name # A foreign key to a specific field
b:
    id:
    something:
and converts them into a basic GraphViz / DOT format which looks like this:
digraph db {
  subgraph clusterperson {
    label = "person";
    structperson [label="{<person__id>id|<person__name>name}",shape=record];
  }
  subgraph clusteraddress {
    label = "address";
    structaddress [label="{<address__id>id|<address__line1>line1|<address__line2>line2|<address__link>link|<address__person>person}",shape=record];
  }
  subgraph clusterorder {
    label = "order";
    structorder [label="{<order__address>address}",shape=record];
  }
  subgraph clustera {
    label = "a";
    structa [label="{<a__letter>letter}",shape=record];
  }
  subgraph clusterb {
    label = "b";
    structb [label="{<b__id>id|<b__something>something}",shape=record];
  }
  structaddress:address__link -> structperson:person__id
  structorder:order__address -> structaddress:address__id
  structa:a__letter -> structperson:person__name
}
Which when ran through the command line tool creates a diagram that looks like:
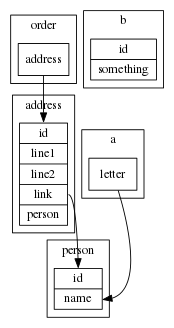
A GraphViz DB diagram, created by DB DiaYAML
The Live Editing and Preview Web Service
In addition to this, if you don't want to install anything, you can use the GitHub hosted mini service.
It's all on GitHub
For the source, go to my GitHub account.
Update 1:
We can now add DOT styles to lines like the following:
order:
  customer:
    link:
      target: person.id # A foreign key to a specific field
      diaprops: # Any GraphViz/Dot property allowed in here
        color: red
So the following diagrams can now be possible:
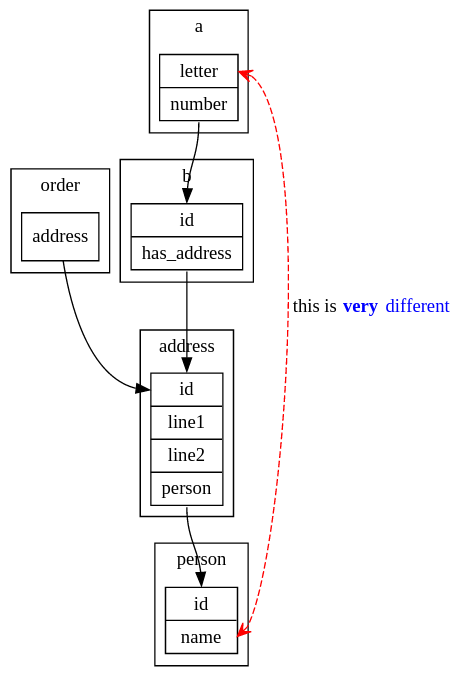
An enhanced GraphViz DB diagram, created by DB DiaYAML
Of course the simpler forms are still supported:
order:
  customer:
    link: person.id
And:
order:
  customer: person.id
And:
order:
  customer: person
So you can be as detailed or brief as you wish!